
Faculty Statistics
| 2016 | 2017 | 2018 | 2019 | 2020 | 2021 | 2022 | 2023* | 2024 | 2025 | |
|---|---|---|---|---|---|---|---|---|---|---|
| Instructional | 344 | 360 | 365 | 386 | 390 | 419 | 530 | 558 | 604 | 639 |
| Minorities | 39 | 42 | 45 | 48 | 54 | 55 | 85 | 91 | 105 | 113 |
| % Minorities | 11.3% | 11.6% | 12.3% | 12.4% | 13.8% | 13.1% | 16.6% | 16.9% | 18.2% | 17.7% |
| Female | 166 | 173 | 180 | 192 | 194 | 206 | 277 | 286 | 308 | 333 |
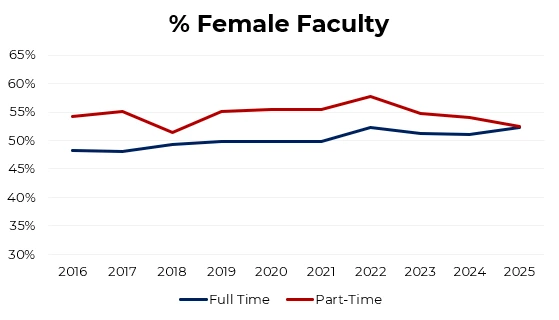
| % Female | 48.2% | 48.1% | 49.3% | 49.7% | 49.7% | 49.2% | 52.3% | 51.3% | 51% | 52.1% |
| Male | 178 | 187 | 185 | 194 | 196 | 213 | 253 | 272 | 295 | 306 |
| Doctorate or Other Terminal Degree | 306 | 318 | 326 | 341 | 345 | 350 | 418 | 451 | 501 | 513 |
| % With Terminal Degree | 88.9% | 88.1% | 89.3% | 88.3% | 88.5% | 83.5% | 78.9% | 80.8% | 82.9% | 80.3% |
*Beginning in 2023, data include medical faculty.
| 2016 | 2017 | 2018 | 2019 | 2020 | 2021 | 2022 | 2023 | 2024 | 2025 | |
|---|---|---|---|---|---|---|---|---|---|---|
| Instructional | 484 | 492 | 550 | 508 | 454 | 500 | 401 | 365 | 346 | 343 |
| Minorities | 33 | 29 | 45 | 46 | 49 | 70 | 45 | 44 | 47 | 50 |
| % Minorities | 6.8% | 5.3% | 8.2% | 9.1% | 10.8% | 11.0% | 12.3% | 12.8% | 14.3% | 14.6% |
| Female | 262 | 271 | 283 | 280 | 252 | 292 | 231 | 200 | 187 | 180 |
| % Female | 54.1% | 55.1% | 51.5% | 55.1% | 55.5% | 58.4% | 57.8% | 54.8% | 54.0% | 52.5% |
| Male | 222 | 221 | 267 | 228 | 202 | 207 | 169 | 165 | 158 | 156 |
*Beginning in 2022, Belmont changed the classification of Five-Month Lecturers and Faculty Fellows from part-time to full-time.
Student-Faculty Ratio: Undergraduate
| Year | 2016 | 2017 | 2018 | 2019 | 2020 | 2021 | 2022 | 2023 | 2024 | 2025 |
| Ratio | 13:1 | 13:1 | 14:1 | 14:1 | 14:1 | 14:1 | 12:1 | 12:1 | 12:1 | 11:1 |
Class Size: Undergraduate
| Year | 2016 | 2017 | 2018 | 2019 | 2020 | 2021 | 2022 | 2023 | 2024 | 2025 |
| % classes < 10 | 11% | 10% | 12% | 17% | 20% | 24% | 19% | 18% | 19% | 17% |
| % classes < 20 | 41% | 43% | 45% | 46% | 53% | 56% | 51% | 58% | 57% | 54% |
| % classes < 50 | 100% | 100% | 100% | 100% | 100% | 100% | 100% | 100%* | 100%* | 100%* |
*class size >50 is less than 1%; numbers are rounded