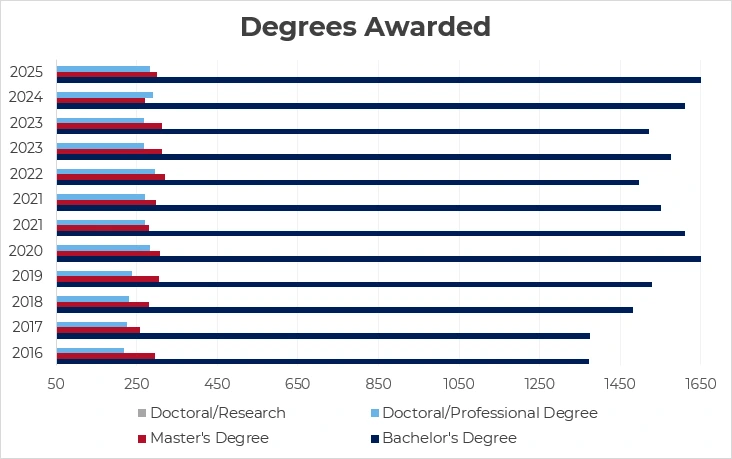
Degrees Awarded
| Year | 2016 | 2017 | 2018 | 2019 | 2020 | 2021 | 2022 | 2023 | 2024 | 2025 |
|---|---|---|---|---|---|---|---|---|---|---|
| Bachelor's | 1373 | 1374 | 1482 | 1528 | 1684 | 1552 | 1496 | 1522 | 1610 | 1690 |
| Master's | 296 | 257 | 281 | 306 | 308 | 297 | 319 | 313 | 271 | 299 |
| Doctoral/Professional | 219 | 226 | 230 | 237 | 282 | 270 | 296 | 268 | 291 | 284 |
| Doctoral/Research | 1 | |||||||||
| Total | 1,888 | 1,857 | 1,993 | 2,071 | 2,274 | 2,119 | 2,111 | 2,103 | 2,172 | 2,274 |
Source: IPEDS Completions Survey
Note: Degrees awarded between July 1 and June 30.